Prometheus
配置 Prometheus 抓取 Casdoor 的运行时指标(API 吞吐量、延迟、CPU、内存等)。为 Casdoor 后端添加一个抓取任务:
global:
  scrape_interval: 10s

scrape_configs:
  - job_name: 'prometheus'
    static_configs:
      - targets: ['localhost:9090']
  - job_name: 'casdoor'
    static_configs:
      - targets: ['localhost:8000']   # Casdoor backend address
    metrics_path: '/api/metrics'
    params:
      accessKey: ['<your-access-key>']
      accessSecret: ['<your-access-secret>']
/api/metrics 需要认证:可以由管理员的浏览器会话调用,也可以用 Prometheus 类型的 密钥 调用。在 Keys 页面创建一个 Prometheus 密钥,把它的 accessKey 和 accessSecret 作为查询参数传入(上面的 params 部分会把它们加到每次抓取请求中)。
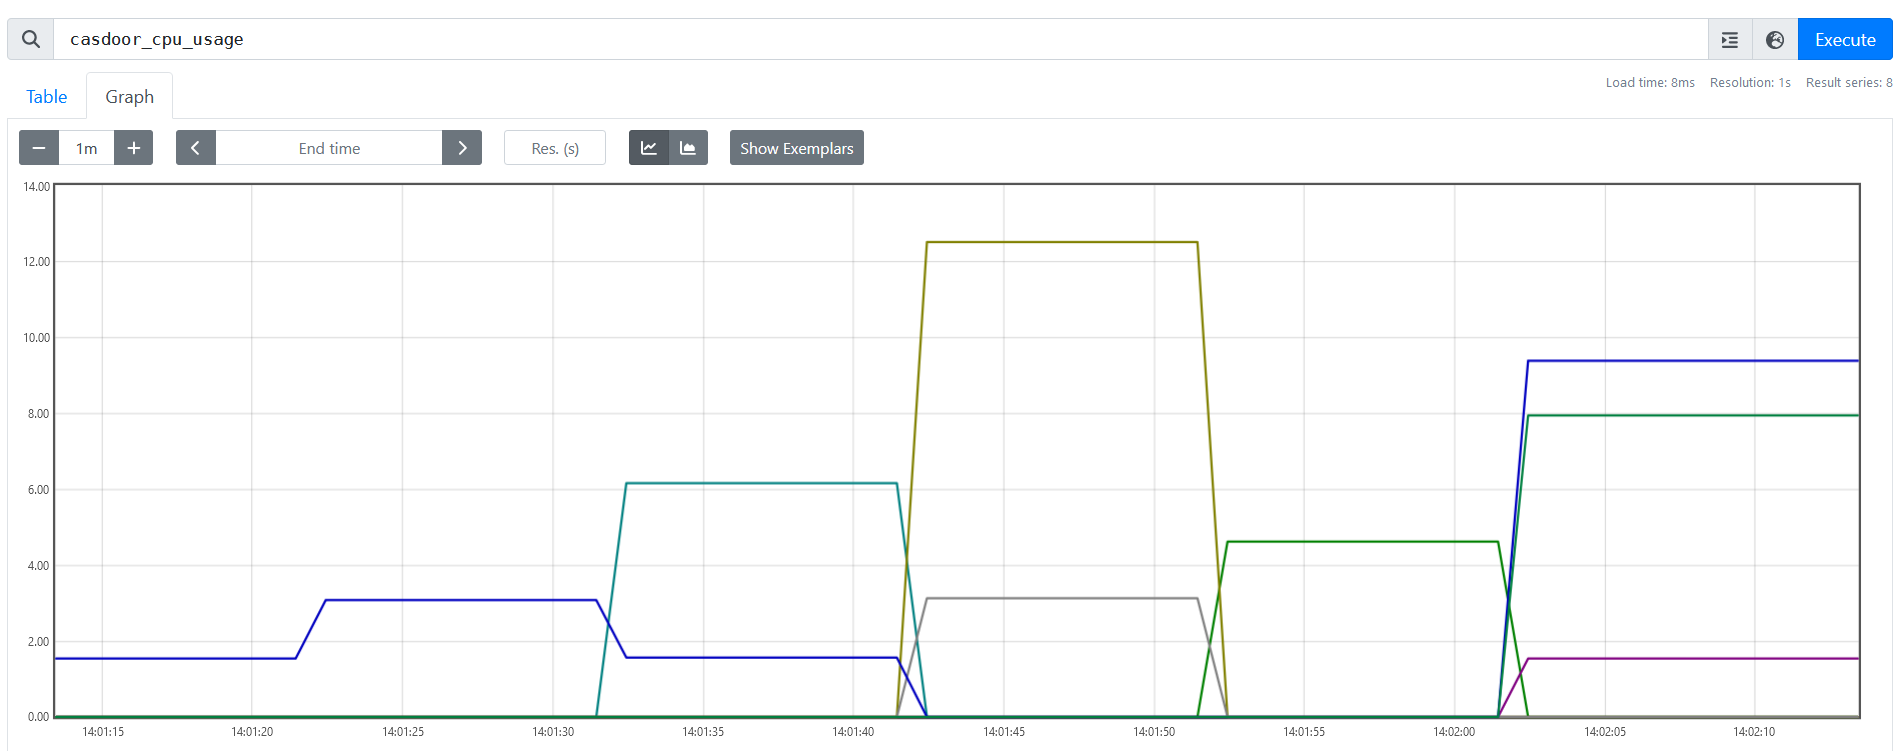
Prometheus 运行并开始抓取后,就可以查询和可视化 Casdoor 指标了(例如在 Grafana 中)。